“Sales of residential non-waterfront and waterfront properties both posted one of the best May levels on record,” said Chuck Murney, President of the Lakelands Association of REALTORS®. “As has been the story for several months now, there just isn’t enough supply coming onto the market to offset the current pace of demand. With inventories still at record lows and competition still heating up among potential buyers it’s no surprise that price gains for both non-waterfront and waterfront properties remain well into the double digits.”
Residential non-waterfront sales activity recorded through the MLS® System for the Lakelands region totaled 396 units in May 2021. This was a substantial increase of 69.2% from the same period in 2020. It also sits 25.5% above the five-year average and 32.7% above the 10-year average for the month of May.
On a year-to-date basis, residential non-waterfront sales totaled a record 1,602 units over the first five months of the year. This was a jump of 73.2% from the same period in 2020.
Sales of waterfront properties numbered 275 units in May 2021. This was an increase of 27.9% from the same period in 2020 and 13.8% above the five-year average, 17.8% above the 10-year average for the month of May.
On a year-to-date basis, waterfront sales totaled a record 922 units over the first five months of the year. This was more than double the levels from a year earlier, leaping 110% from the same period in 2020.
The MLS® Home Price Index (HPI) tracks price trends far more accurately than is possible using average or median price measures. The overall MLS® HPI single-family benchmark price was $606,200 in May, a jump of 48.8% on a year-over-year basis.
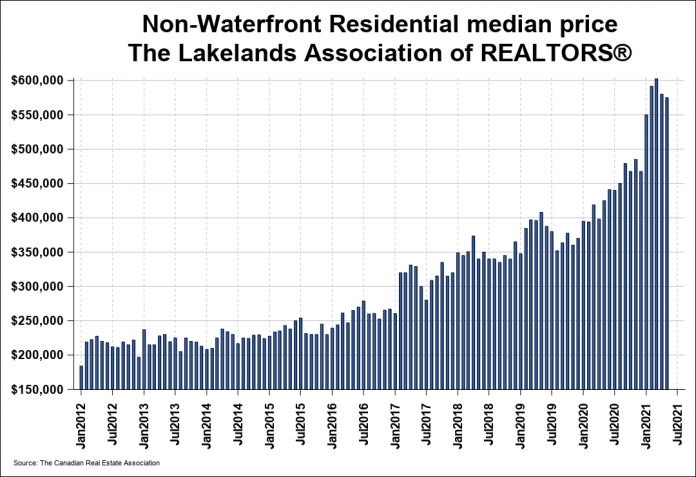
The median price for residential non-waterfront property sales in May 2021 was $575,000, a substantial gain of 35.3% from May 2020. The more comprehensive year-to-date residential non-waterfront median price was $580,000, an advance of 42.3% from the first five months of 2020.
The median price for waterfront property sales in May 2021 was a record $925,000, a substantial gain of 56.8% from May 2020. The more comprehensive year-to-date waterfront median price was $881,500, an advance of 64.8% from the first five months of 2020.
The total dollar value of all residential non-waterfront sales in May 2021 was $249.6 million, more than double the levels from a year earlier, increasing 131% from the same month in 2020. This was also a new record for the month of May.
The total dollar value of all waterfront sales in May 2021 was $328.5 million, a substantial increase of 64.4% from the same month in 2020. This was also a new record for the month of May.
| Summary – Sales by Housing Type | |||
|---|---|---|---|
| Category | May 2021 | May 2020 | Year-over-year % change |
| Non-Waterfront Residential | 396 | 234 | 69.2 |
| Waterfront | 275 | 215 | 27.9 |
| Includes transactions in all areas recorded by The Lakelands Association of REALTORS® | |||
| Summary – Median Price by Housing Type | |||
|---|---|---|---|
| Category | May 2021 | May 2020 | Year-over-year % change |
| Non-Waterfront Residential | $575,000 | $425,000 | 35.3 |
| Waterfront | $925,000 | $590,000 | 56.8 |
| Includes transactions in all areas recorded by The Lakelands Association of REALTORS® | |||
| Detailed – Non-Waterfront Residential Sales and Median Price by Area / Non-Waterfront Residential | ||||||
|---|---|---|---|---|---|---|
| Area | May 2021 | May 2020 | Year-over-year % change | May 2021 | May 2020 | Year-over-year % change |
| Muskoka | 148 | 65 | 127.7 | $600,000 | $420,000 | 42.9 |
| Haliburton | 35 | 13 | 169.2 | $425,000 | $307,000 | 38.4 |
| Orillia | 134 | 105 | 27.6 | $665,000 | $465,000 | 43 |
| Parry Sound | 10 | 10 | 0 | $397,500 | $352,500 | 12.8 |
| All Other Areas | 69 | 41 | 68.3 | $421,000 | $370,000 | 13.8 |
| Includes transactions in all areas recorded by The Lakelands Association of REALTORS® | ||||||
| Detailed – Waterfront Sales and Median Price by Area / Waterfront | ||||||
|---|---|---|---|---|---|---|
| Area | May 2021 | May 2020 | Year-over-year % change | May 2021 | May 2020 | Year-over-year % change |
| Muskoka | 97 | 71 | 36.6 | $1,010,000 | $830,000 | 21.7 |
| Haliburton | 62 | 51 | 21.6 | $895,500 | $520,000 | 72.2 |
| Orillia | 32 | 25 | 28 | $1,200,000 | $657,500 | 82.5 |
| Parry Sound | 9 | 1 | 800 | $608,000 | $215,000 | 182.8 |
| All Other Areas | 75 | 67 | 11.9 | $850,000 | $495,000 | 71.7 |
| Includes transactions in all areas recorded by The Lakelands Association of REALTORS® | ||||||


